Clocks & Sleep 2024, 6(1), 200-210; https://doi.org/10.3390/clockssleep6010014 - 21 Mar 2024
Viewed by 1491
Abstract
The circadian system, a vital temporal regulator influencing physiological processes, has implications for cancer development and treatment response. Our study assessed circadian timing’s impact on whole-brain radiotherapy outcomes in brain metastases for personalized cancer therapy insights. The aim of the study was to
[...] Read more.
The circadian system, a vital temporal regulator influencing physiological processes, has implications for cancer development and treatment response. Our study assessed circadian timing’s impact on whole-brain radiotherapy outcomes in brain metastases for personalized cancer therapy insights. The aim of the study was to evaluate circadian influence on radiation treatment timing and its correlation with clinical outcomes and to identify patient populations benefiting from interventions synchronizing circadian rhythms, considering subgroup differences and potential disparities. An IRB-approved retrospective analysis of 237 patients undergoing whole-brain radiotherapy for brain metastases (2017–2021), receiving over 80% of treatments in the morning or afternoon, was performed. Survival analyses utilized Kaplan–Meier curves. This was a single-institution study involving patients receiving whole-brain radiotherapy. Demographic, disease, and socioeconomic parameters from electronic medical records were collected. Morning treatment (n = 158) showed a trend toward improved overall survival vs. afternoon (n = 79); the median survival was 158 vs. 79 days (p = 0.20, HR = 0.84, CI95% 0.84–0.91). Subgroup benefits for morning treatment in females (p = 0.04) and trends in controlled primary disease (p = 0.11) and breast cancer metastases (p = 0.08) were observed. Black patients exhibited diminished circadian influence. The present study emphasized chronobiological factors’ relevance in brain metastases radiation therapy. Morning treatment correlated with improved survival, particularly in specific subgroups. Potential circadian influence disparities were identified, laying a foundation for personalized cancer therapy and interventions synchronizing circadian rhythms for enhanced treatment efficacy.
Full article
(This article belongs to the Special Issue Sleeping for Health: Mechanistic Insights)
►
Show Figures
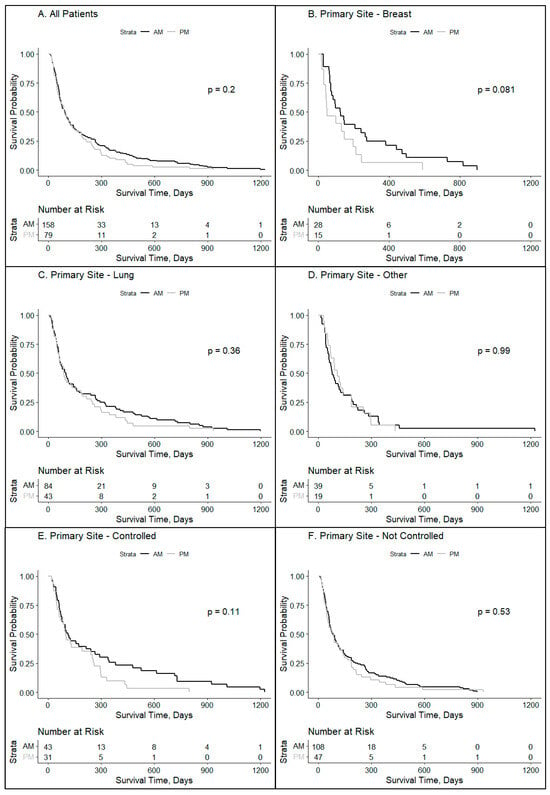
Figure 1

Figure 3


